After attending the FOSS4G conference (see my last blog post) a couple of weeks ago, I was inspired to take a fresh look at the technologies that were on display there.
We have been involved (via rollouts, training, and customisation) in the increase in the use of QGIS in the past year or so. Interestingly, the majority of these users are still using shapefiles to store data rather than in a database. There are a number of advantages to using a database – and there is an existing open source spatial database that works really well with QGIS – PostGIS, the spatial extension for the PostgreSQL open source database.
I thought it would be interesting to use the simple example of creating a dynamic convex hull around a set of points to show how powerful using a spatial database can be.
The first step is to install QGIS and PostGIS. If you haven’t done that already, this is easy to do if you are on Windows using the installers here and here. Both of these open source software packages have great documentation if you get stuck, but a couple of tips are:
- make sure to make a note of all your settings when doing the PostGIS install, and
- make sure you run the StackBuilder to install PostGIS after doing the main PostgreSQL install.
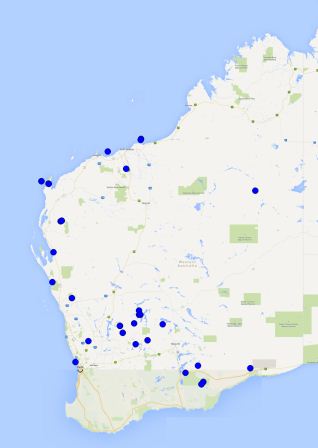
The next step is to get some data, I used the OZCAM species occurrence records for Western Australia, but any point records would do the same job for this simple example. This data represents the publicly available points from within the Museum community within Australia, so it’s essentially vouchered specimen data.
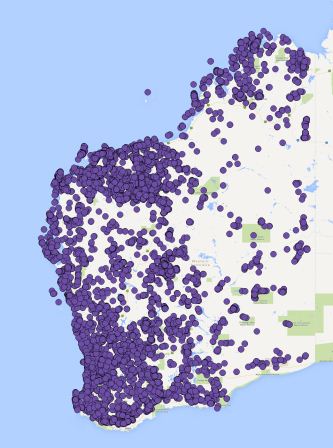
These raw species records were downloaded as a shapefile, so we now need to get them into PostGIS. There are a bunch of ways to do this but seeing we are using QGIS to view the data let’s also use it to load the data.
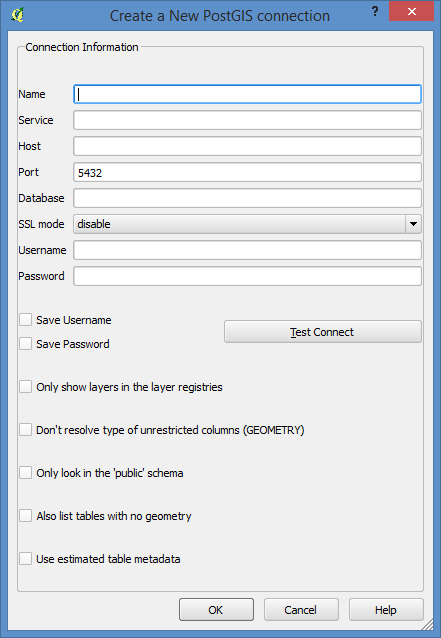
The first thing to do is make a connection to your PostGIS database using the settings from the installation (Layers > Add PostGIS Layers > New).
Once you have a database connection we can load to shapefile into the database using DB Manager (Database > DB Manager > DB Manager).
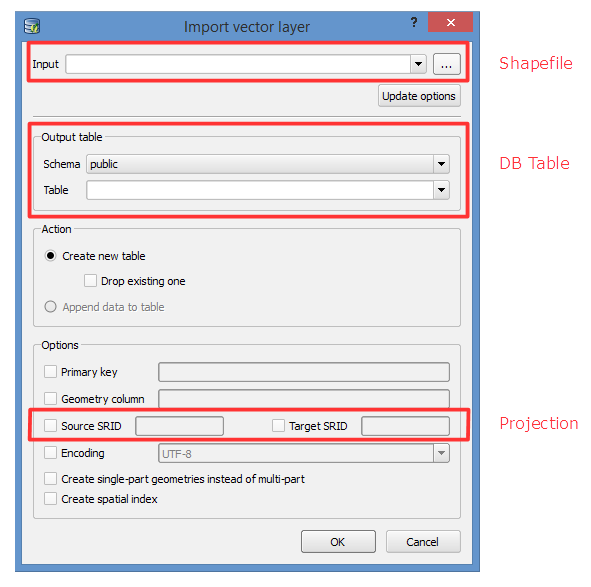
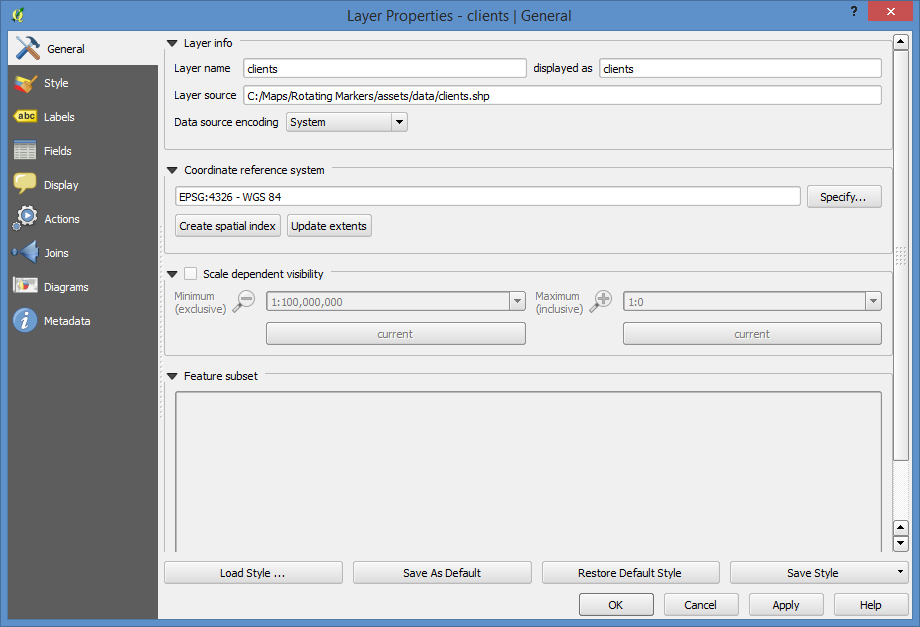
Projections in PostGIS and QGIS are defined by code that is somewhat interchangeably called a SRID, EPSG or CRS. To figure out what the code is for your data you can open it in QGIS, right-click on the layer in the table of contents, choose Properties and the code will be found on the General tab, under the Coordinate Reference System component in the middle of the window.
Now that our data are loaded into the database we are also able to connect, view and edit it from QGIS (Layers > Add PostGIS Layers). More importantly, we can start to use some of the other features that make relational databases so powerful.
The first thing I am going to do is filter our existing data to a single species, again there are a few different ways to do this but I am going to keep it simple and use a filter in QGIS. Right click on the layer and select filter and then use the query builder to create a filter, I used scientific name = Tadarida australis. This species is an endemic bat that is found fairly commonly throughout most of Australia (and it’s one we’ve been recording in our bat survey of the Perth region, which is on hiatus while we deal with several years worth of data, as we alluded to in a blog post at the start of the year).
Using PostGIS, we can now create really simple approximation of the range of the species using a convex hull. To do this I used pgAdminIII which is a management tool for the PostgreSQL database that underlies PostGIS. pgAdminIII usually comes preinstalled with PostGIS – if you are using Windows you should be able to find it in the PostgreSQL folder under the start menu. When you start up the tool you will need to connect to your database in much the same way as in QGIS, once you have done that you can run SQL commands directly on the database.
I created a view on my species points using the SQL below. A view is essentially a dynamic table created from other data using a SQL query, similar to a definition query in ArcGIS or a filter in QGIS but much more powerful.
create or replace view species_range as select ‘1’::integer as “id”, st_convexhull(st_collect(geom)) as geom from ozcam where “scientific name” = ‘Tadarida australis’;
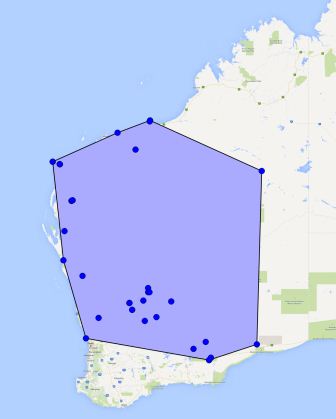
QGIS can display a view in the same way as a table and if we do that the result looks something like this:
Now for the fun stuff – remember that the species range polygon is created dynamically, so every time we refresh the layer the SQL query underlying the view gets rerun and the data is recreated. If we were to delete a point from the species records table and refresh QGIS you can see that the convex hull gets dynamically regenerated…
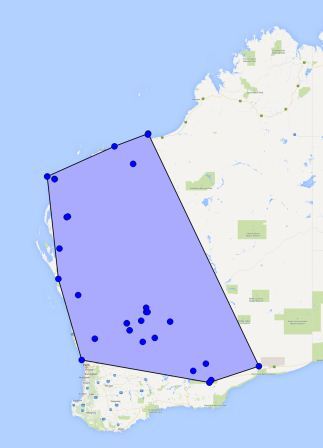
This is extremely powerful if you have a dataset that is frequently updated or if we were applying a more complex analysis to the underlying layer. PostgreSQL also allows for the creation of custom functions, so we could even use a more accurate species distribution algorithm if we wanted to.
Using a spatial database comes with some great benefits and is easy to get started, so why not give it a go on your next project. As always we are here to help, so drop me a comment below, or an email. You can even contact us through Facebook, Twitter or LinkedIn.
Andrew
Comments are closed.